Alert based on Xano exec. time
Let’s say you want to monitor all your endpoints at once and be notified if one of them has an unusually high execution time. With ncScale that task becomes 100x easier.
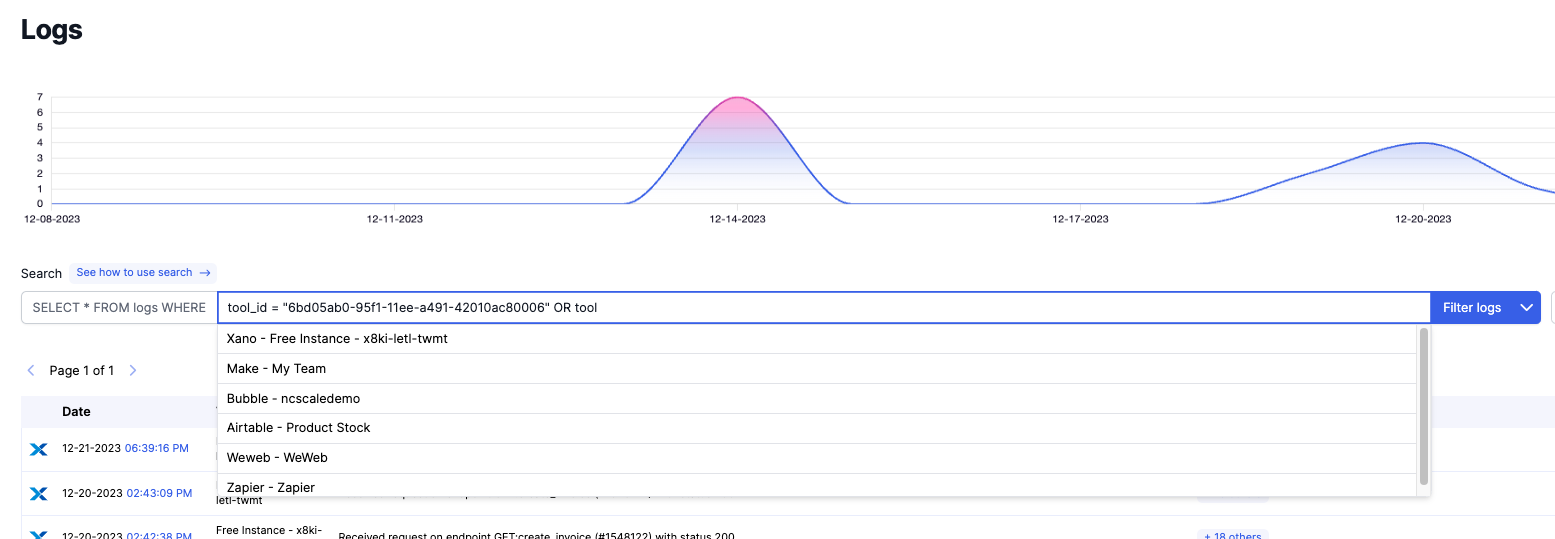
First, go on the "Logs" tab. Then, in the query, type tool to trigger the auto-completion system, and get the list of all your tools in your ncScale application, and select your Xano tool.
If you have more than one Xano tool connected to your ncScale application, and want to set up a single alert for all your Xano tools, you can add the OR operator and type again the word tool to trigger the auto-completion as much as you need.
 When you're done picking all your Xano tools, put you query into a set of
 ( ).
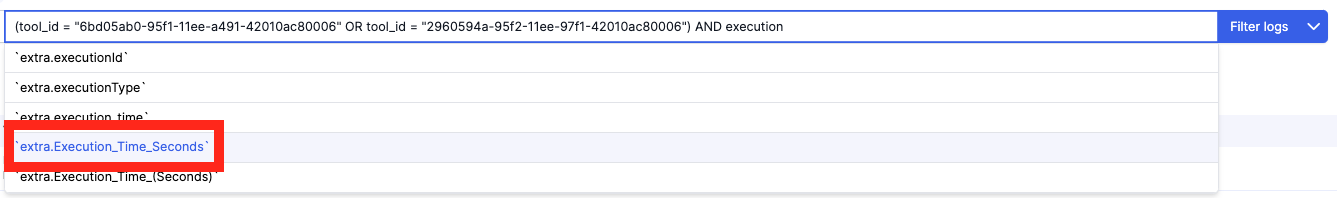
After, type execution and select "extra.Execution_Time_Seconds".
If there is multiple versions of the key "extra.Execution_Time_Seconds", be sure to pick the one with capital letters and _, otherwise, you might be picking a key not designed for Xano logs.
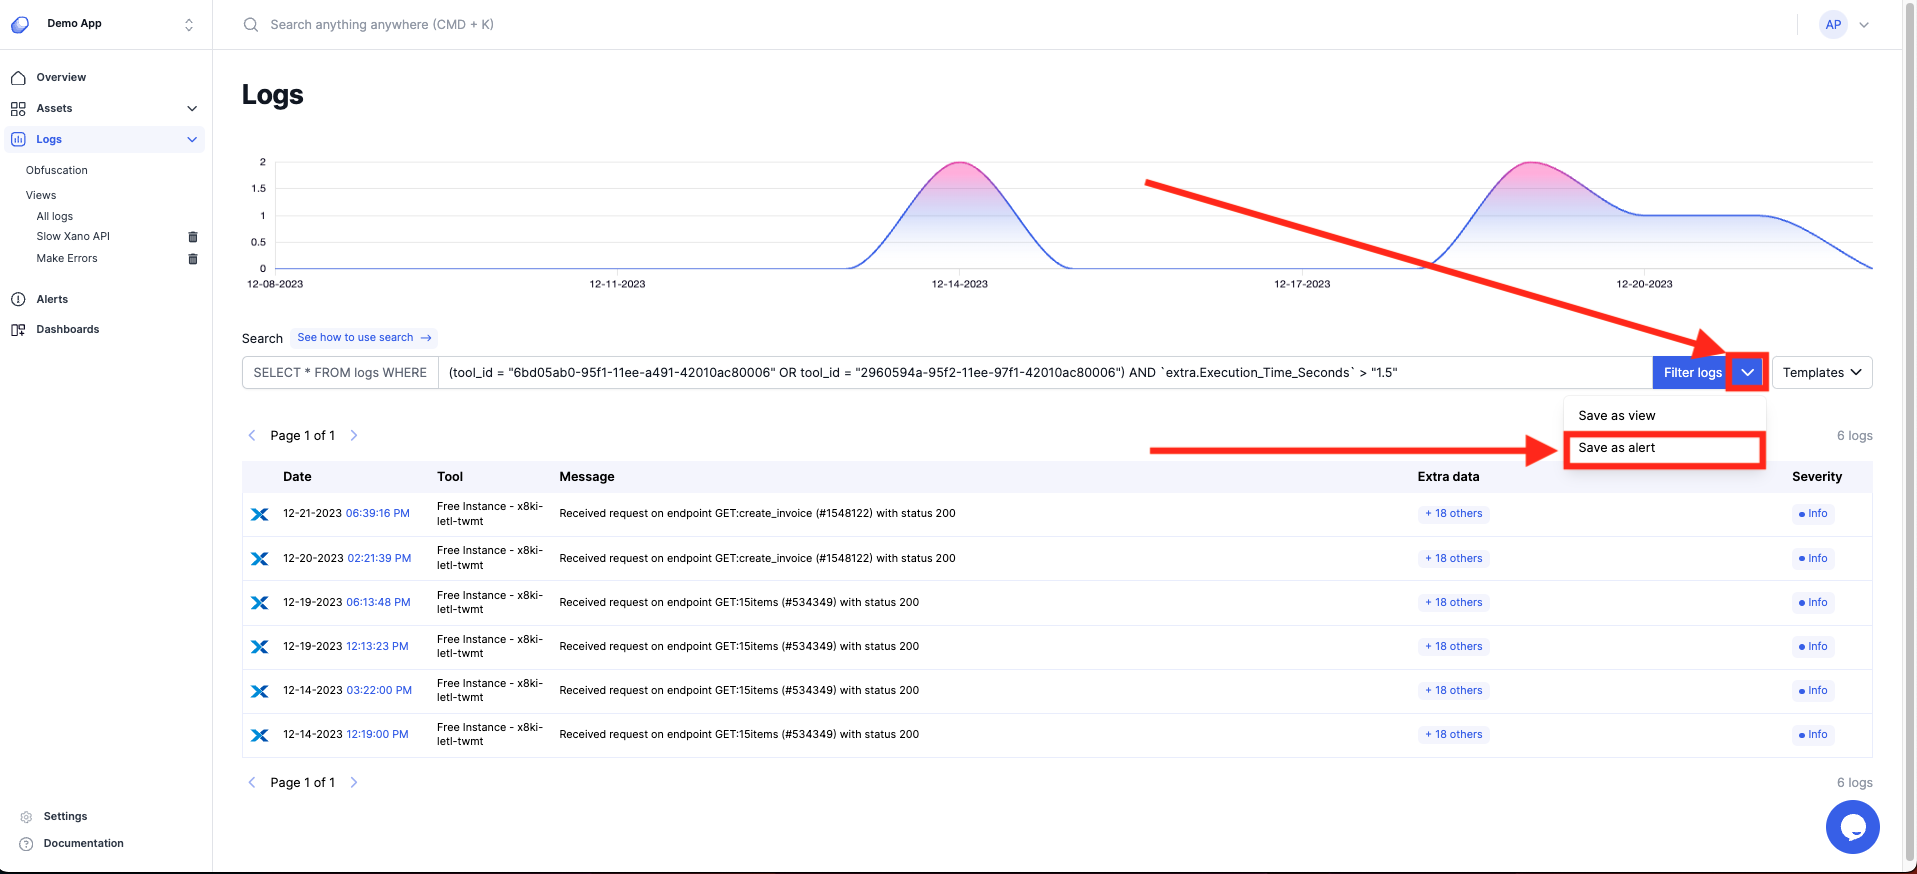
Replace the = by a >, and add the duration (in seconds). Choose a duration above which you find the execution time is taking too long.
And the final query should be like this :

Then, click on "Save as alert" and all you have to do now is to configure your alert.