Overview
Introduction
Welcome to the overview of your application! This page enables you to track your application's activity, the changes you made to it, its overall health, and more.
In the following part of this brief overview feature tour, we will delve into the statistics you can find there and how to interpret them.
These statistics are updated each time you synchronize your stack. Therefore, we recommend synchronizing it regularly for optimal tracking. (See: asset documentation)
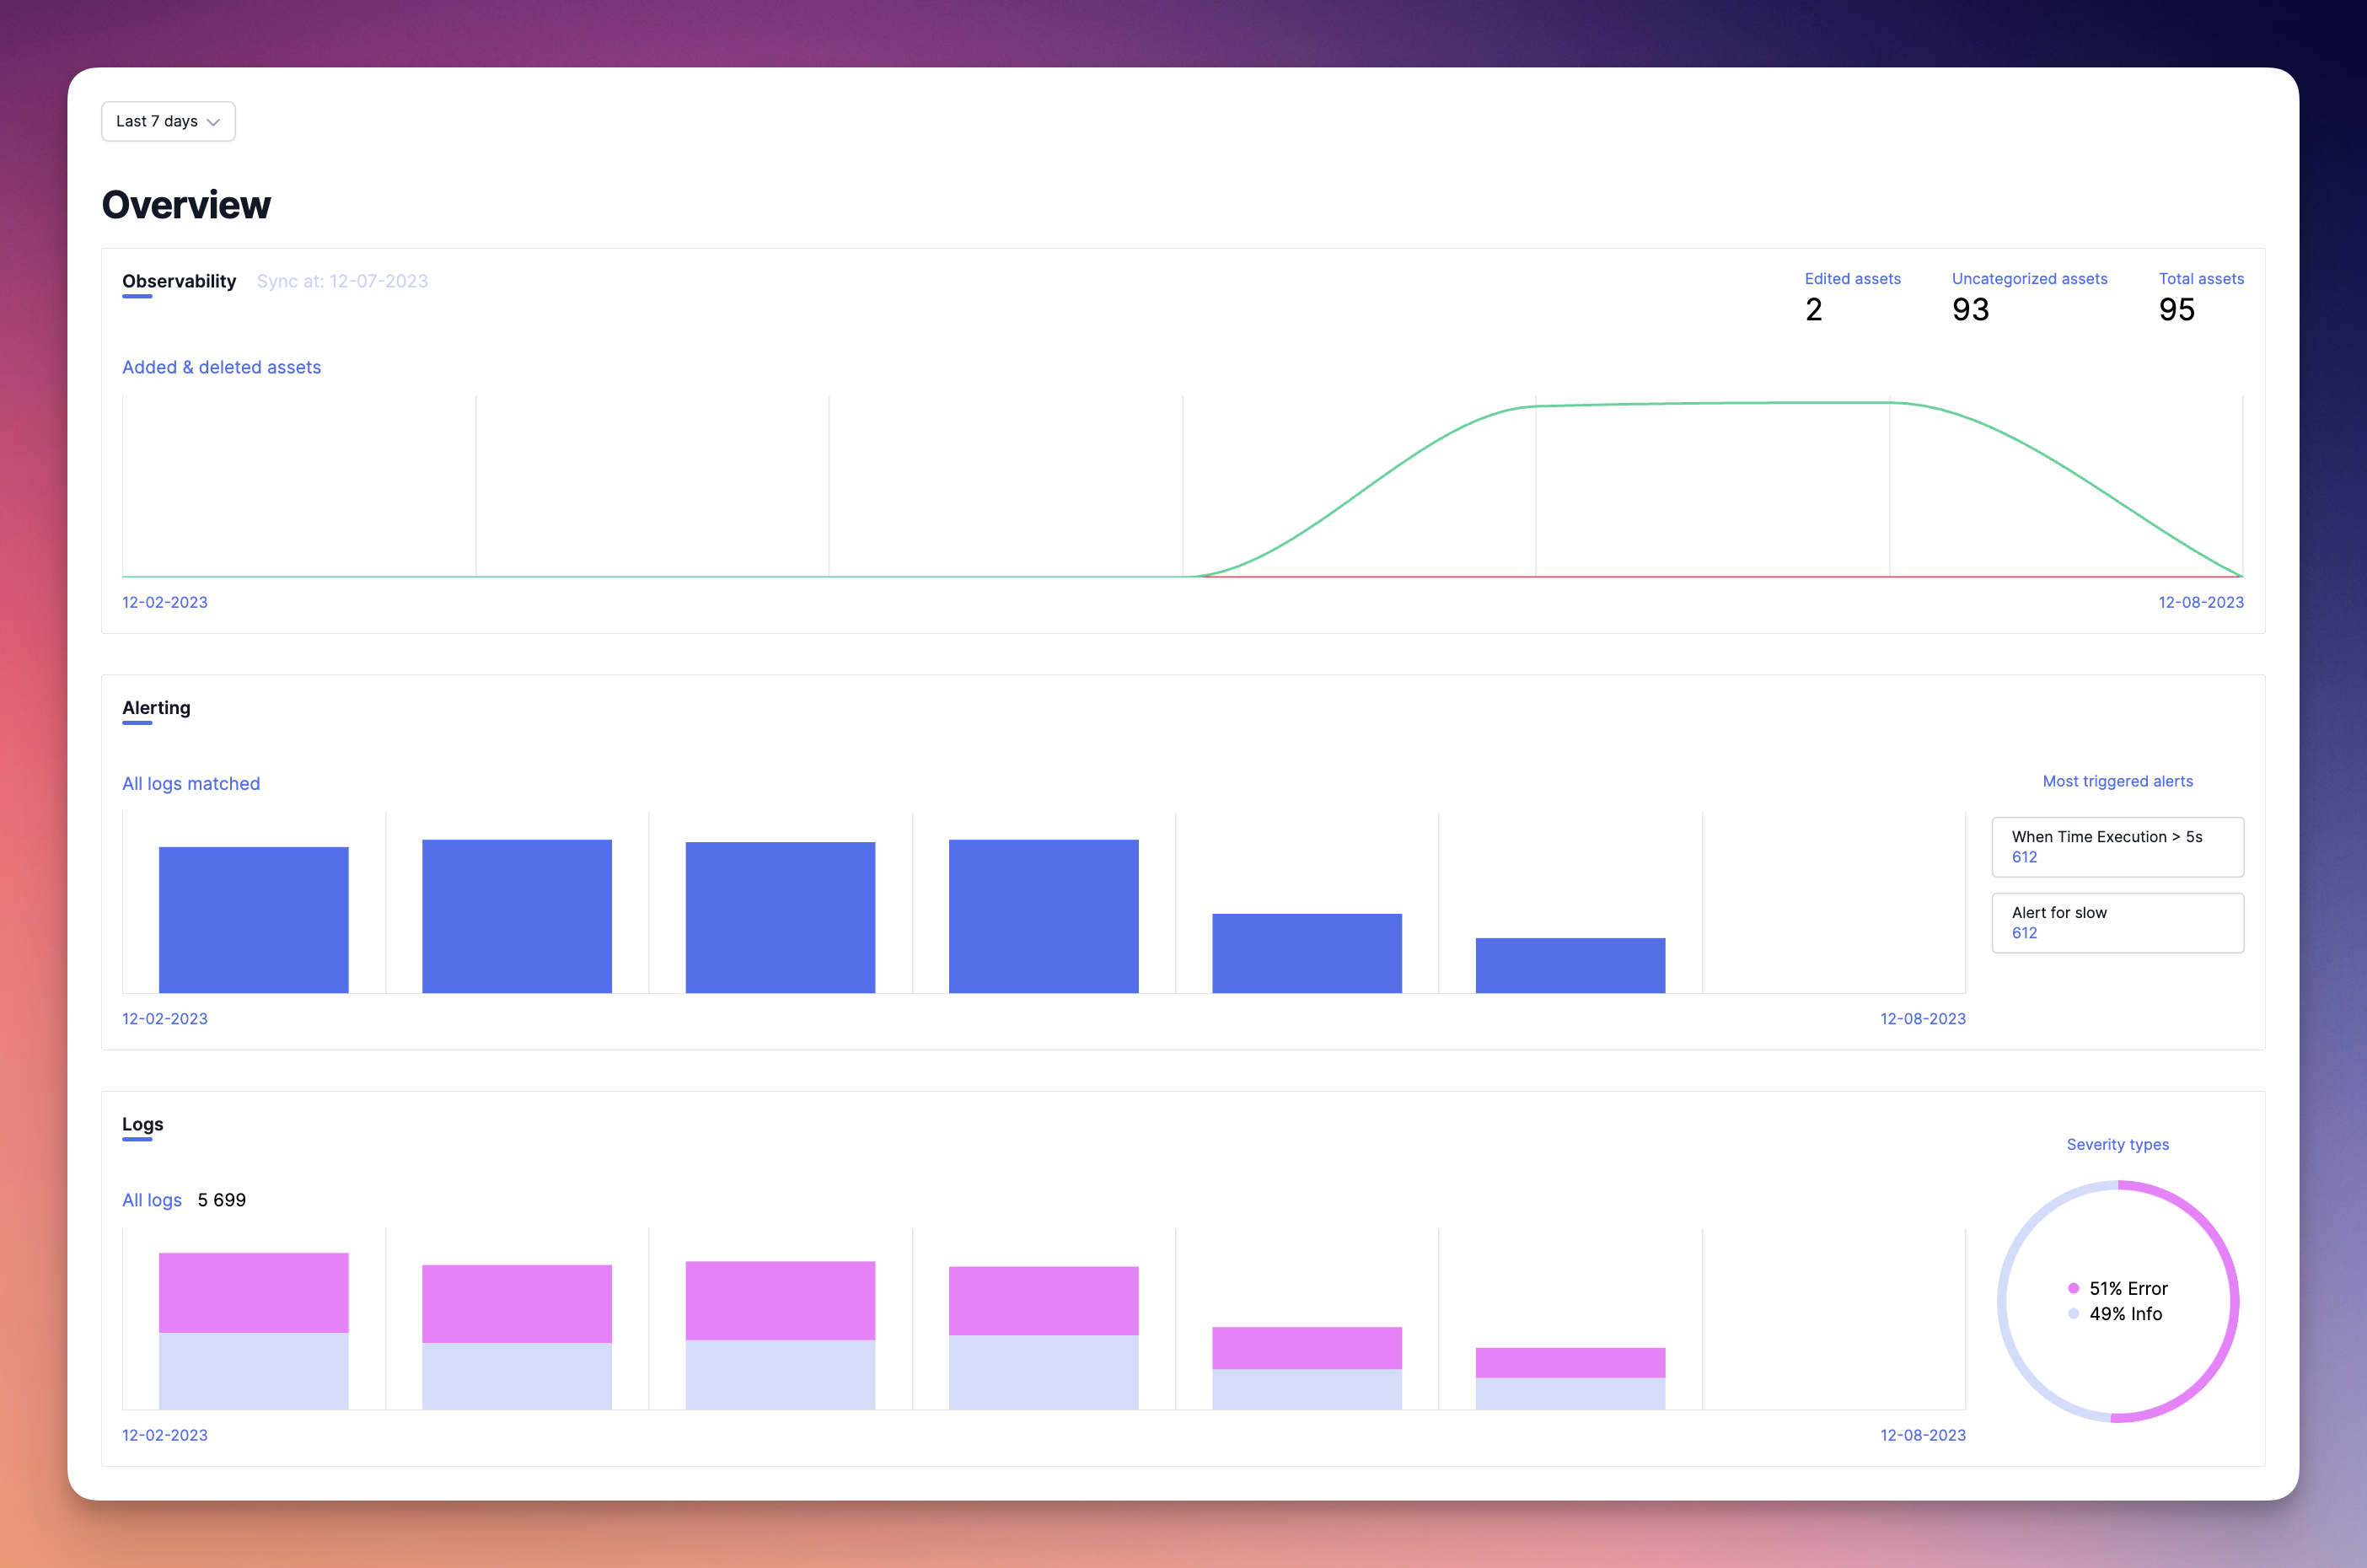
At the top left of this page, you'll find a selector that allows you to choose the time frame for the overview. By default, we display the last 7 days.
Sometimes, it's good to take a step back. That's why choosing a larger time range can help you visualize what has happened, for example, over the past month.
If there's an ongoing issue in your stack, and you'd like precise statistics to assess the impact, choosing the "Today" time range will assist you in this task.
Assets Catalog
We believe that understanding the evolution of your stack is crucial. That's why, with the Assets Catalog chart provided on the overview page, you can track changes in your assets, such as the number of assets that has been modified, added, and deleted.
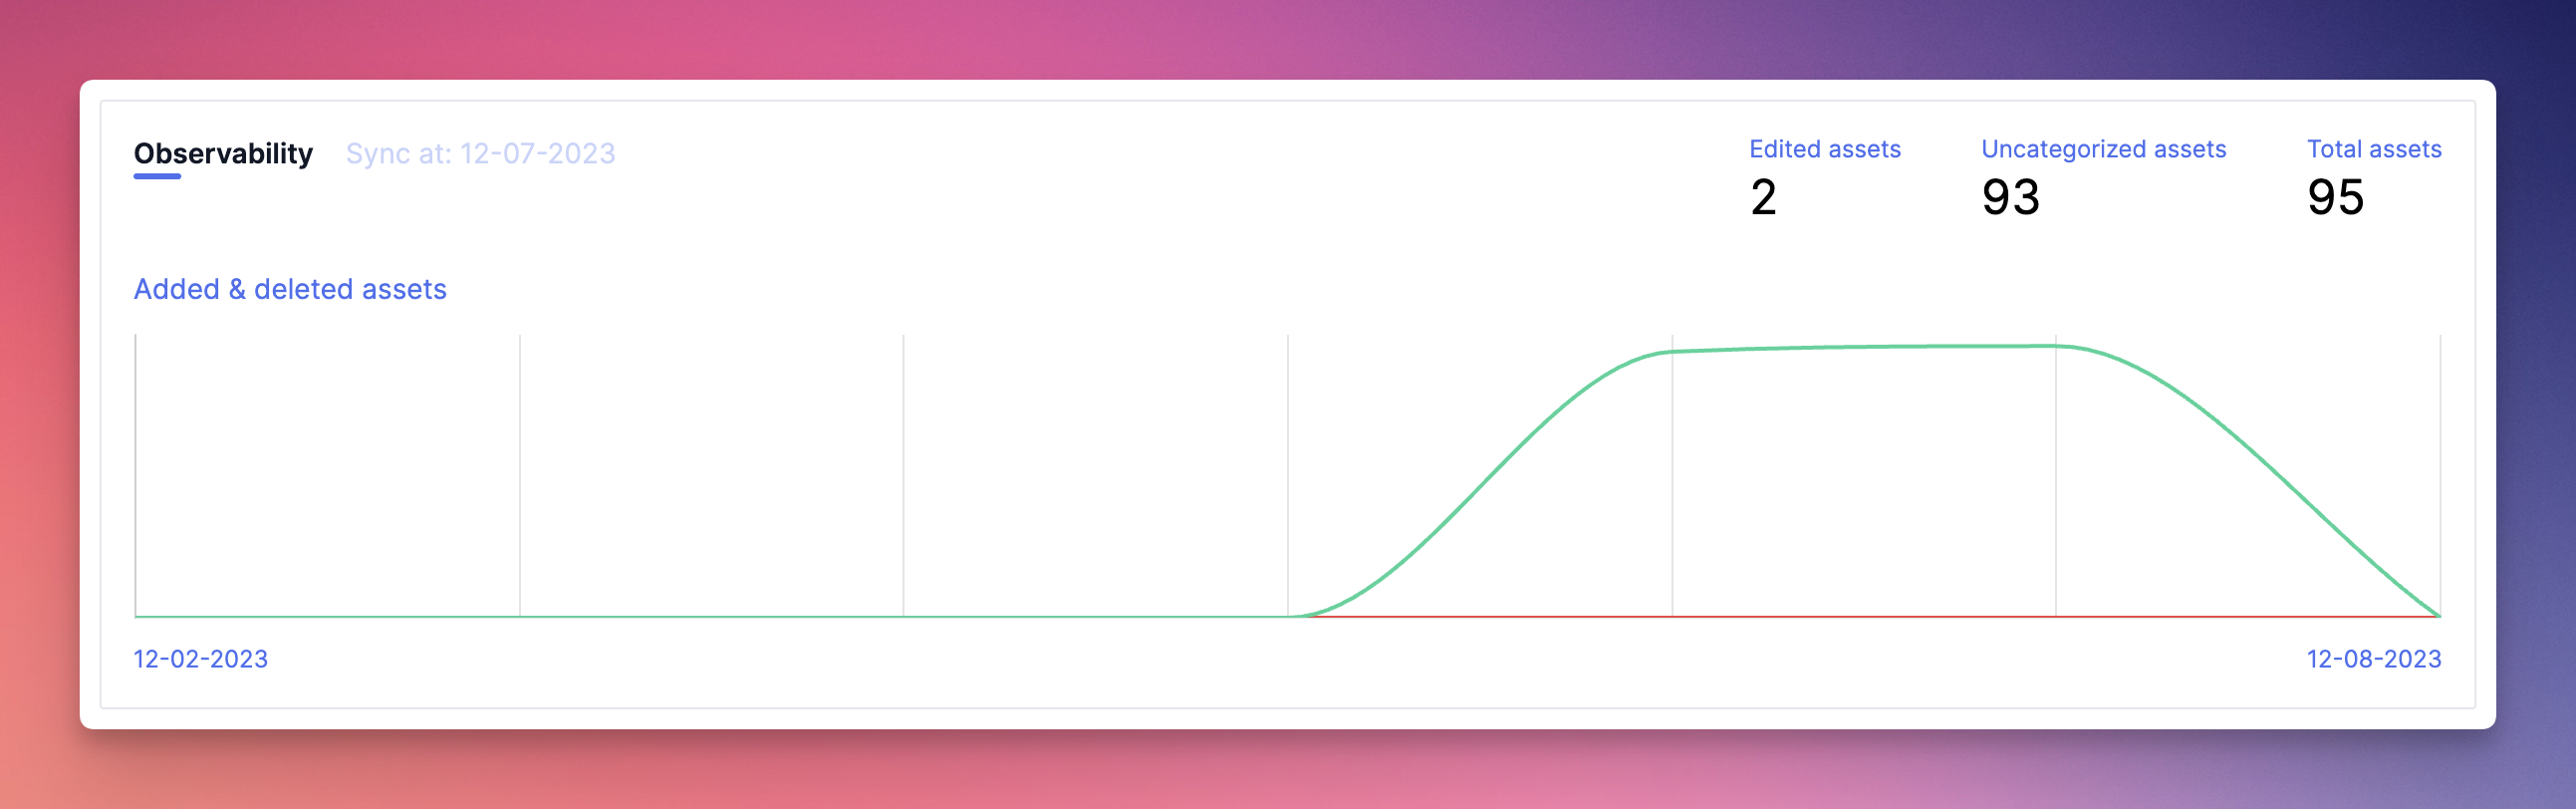
We recommend categorizing your assets extensively to have a clear view of each asset's purpose. Therefore, the "uncategorized assets" data will show you the number of assets that still need categorization. If you reach 0, you are among the best. 💪
We consider an asset "categorized" if you have added at least one tag, an owner, a priority, or if you have documented it on the asset page. I refer you to the asset documentation for more details on this matter.
Alerting
The alerting graph allows you to know the number of logs that have matched with at least one alert you previously configured (See: Alerting documentation for creating an alert) during the selected period. On the right side of the graph, you will also find the top 3 alerts that have been triggered the most, along with the number of times they have been triggered.
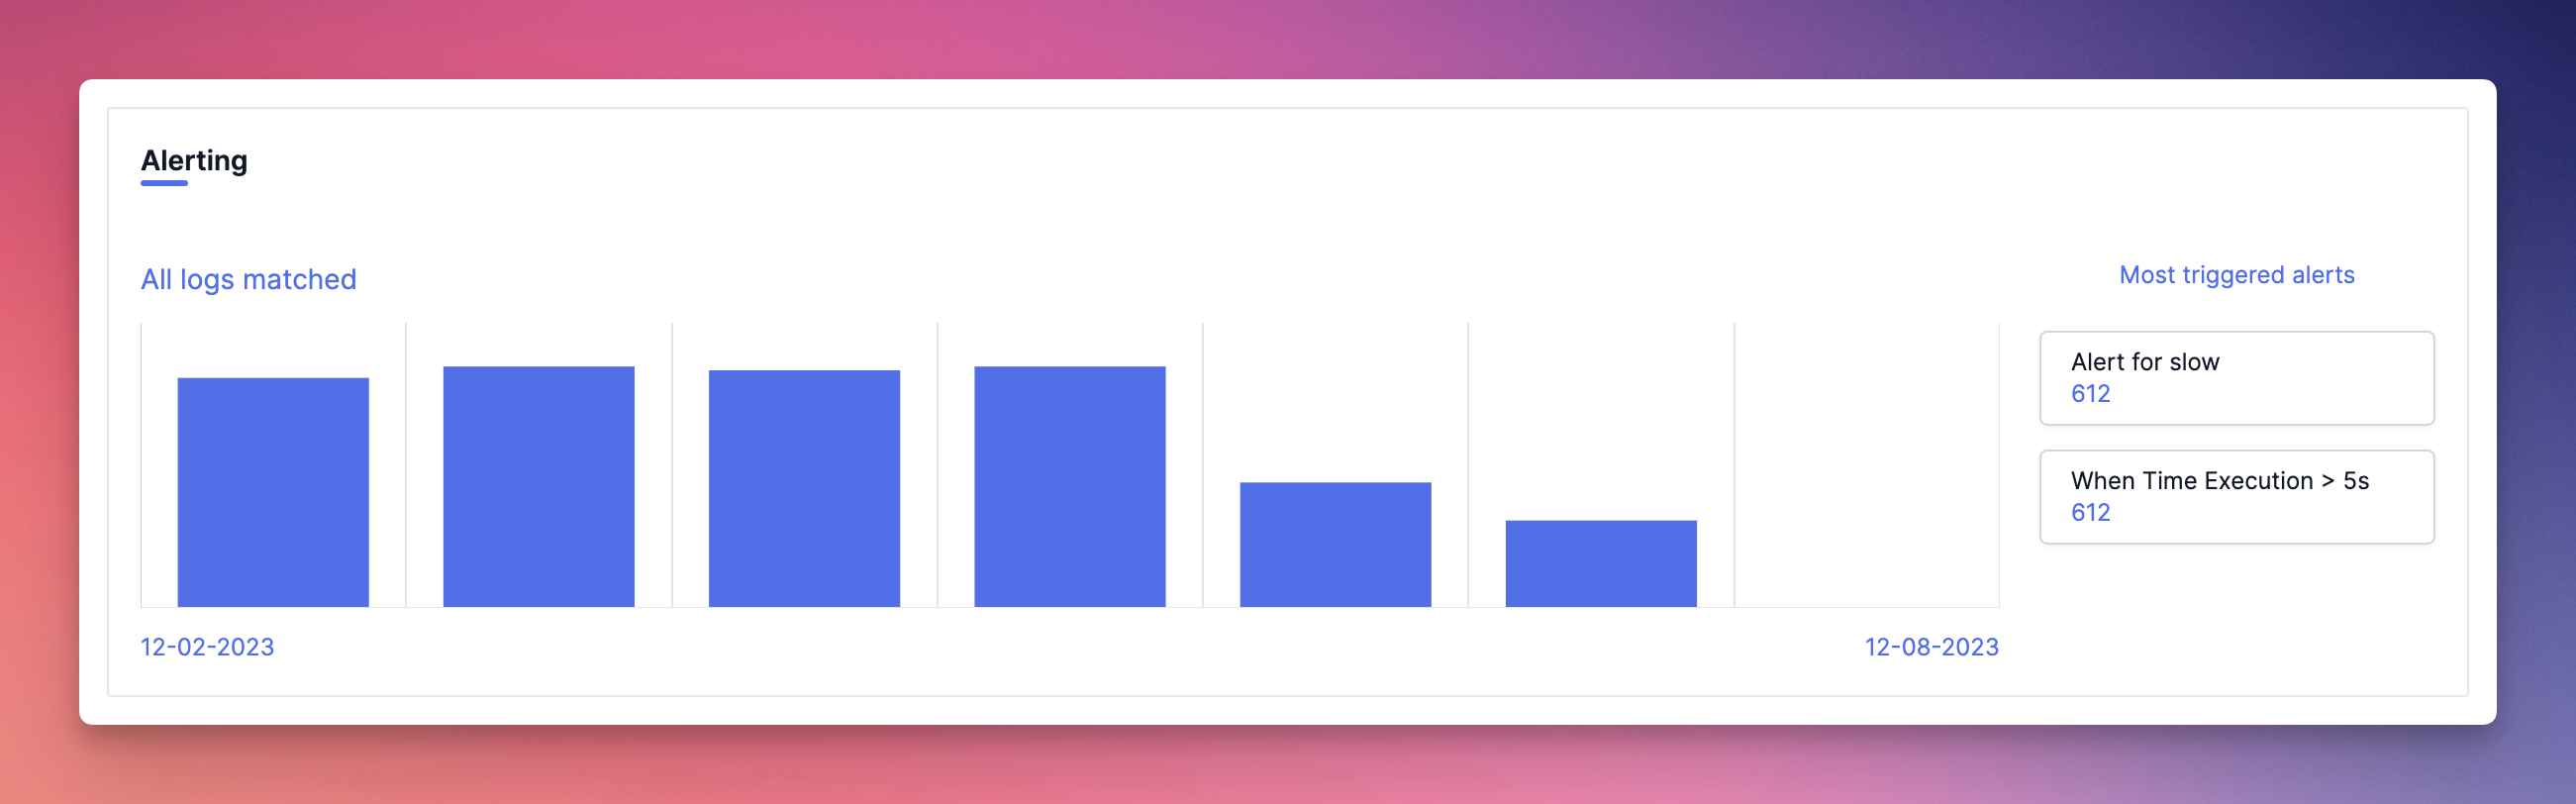
No alerts on your application yet?
Don't worry, a list of templates will be provided, and you can quickly create one. These templates cover the most common needs.
Logs
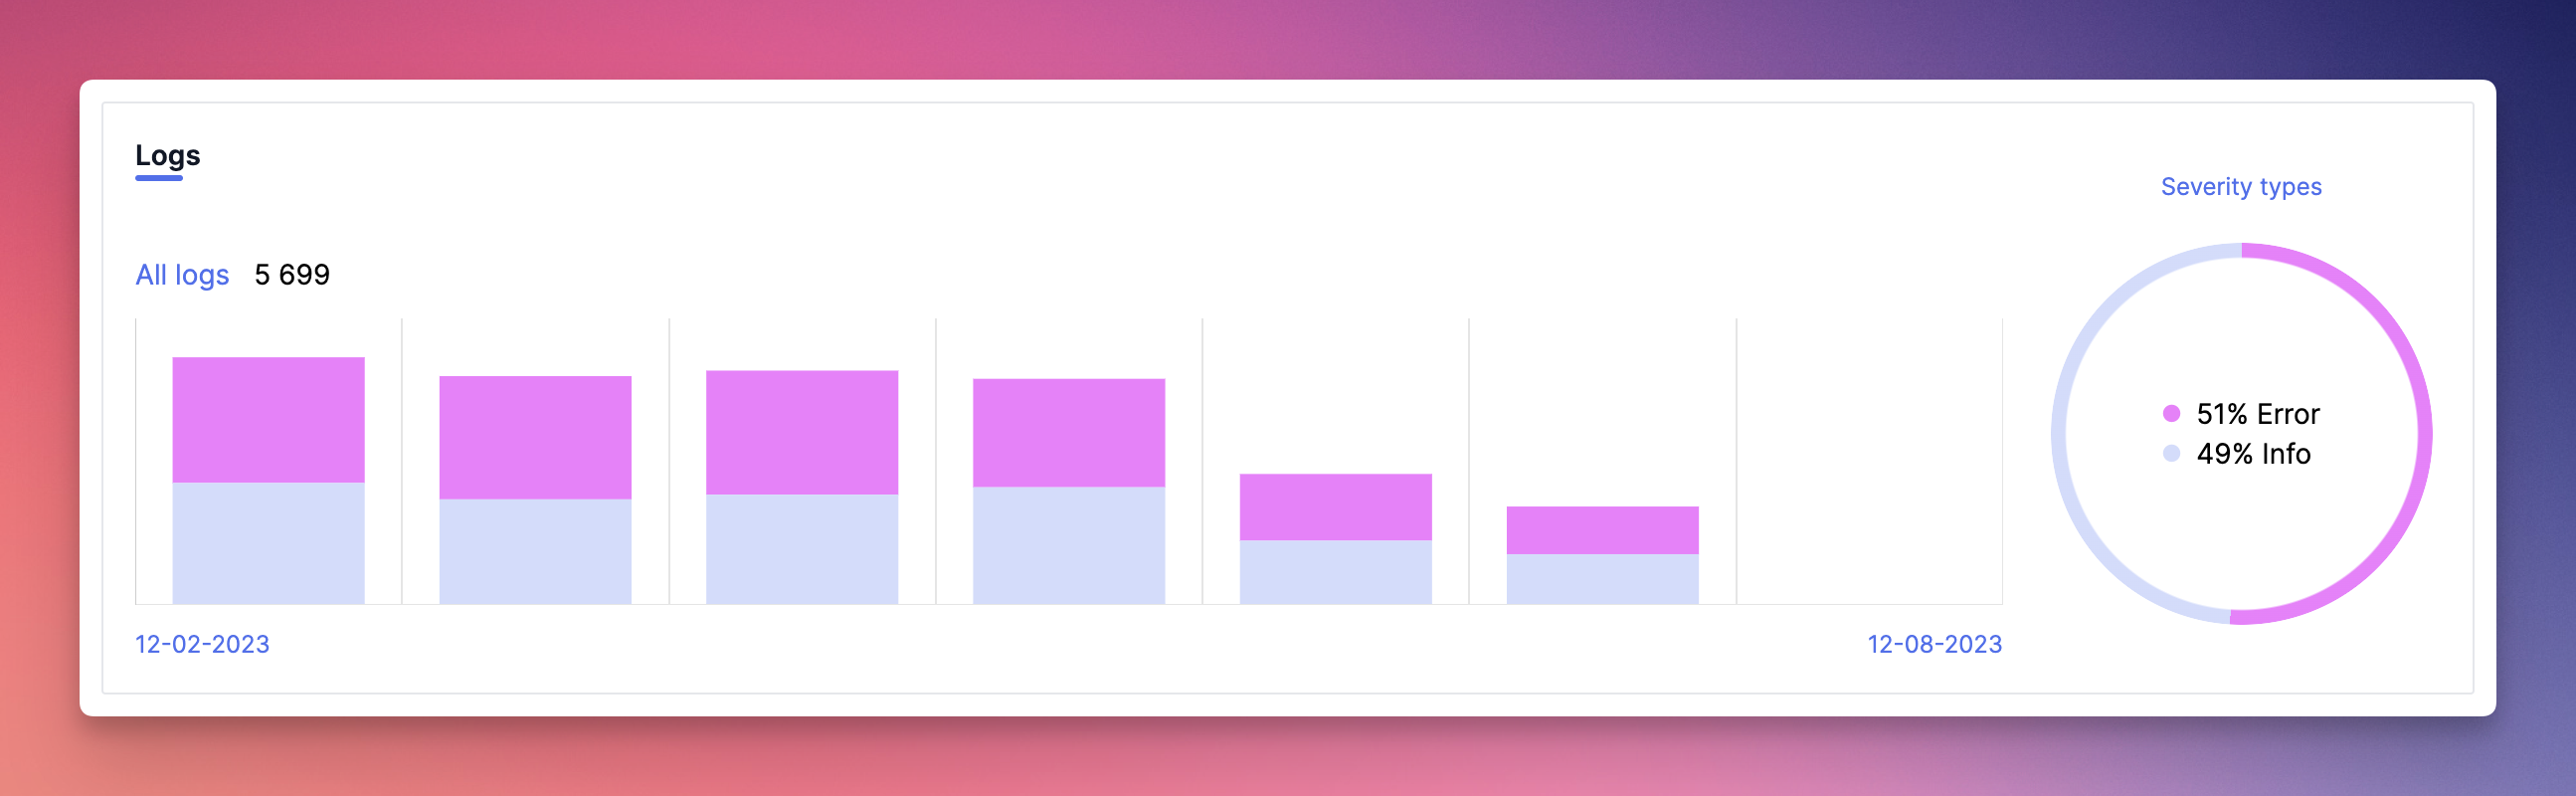
Logs are crucial data for an application, which is why you'll find a chart here that provides an overview of the total number of logs ingested in the selected time period, as well as the number of logs per day (or per hour for the "today" and "yesterday" time ranges) grouped by severities.
On the right side of the chart, you will find a pie chart that indicates the percentage of logs by severity.
How to interpret this data ?
The overview page provides you with a significant amount of information about the health of your application, particularly with the portion of logs categorized as "error" or "critical," indicating that something is not functioning correctly. Additionally, the number of uncategorized assets offers a clear insight into its operation.
With a glimpse, be reassured! 😉