Dashboards
Introduction
The ncScale dashboard feature provides you with an overall view of the operational status of your stack. Divided into two dashboards, you'll find APM-related information on workflow execution on one side and an overview of your assets with their statistics on the other side.
APM Dashboard
On the APM (Application Performance Monitoring) dashboard, you have quick access to performance indicators for your application, such as the number of calls to your various workflows, the average execution time of each workflow, and other information to identify the slowest or unused workflows, or vice versa, to react as needed. APM utilizes data from your logs to be generated; tools without monitoring activated or without logs will be ignored.
At the top right of the page, you have the option to choose a time period for which you want the information to be displayed. You can select yesterday, today, the last 7 days, or the last 30 days.
The differences in data received by publishers currently allow us to integrate only a certain number of tools into the APM. Here is the list of tools currently supported by the APM:
- Make
- Xano
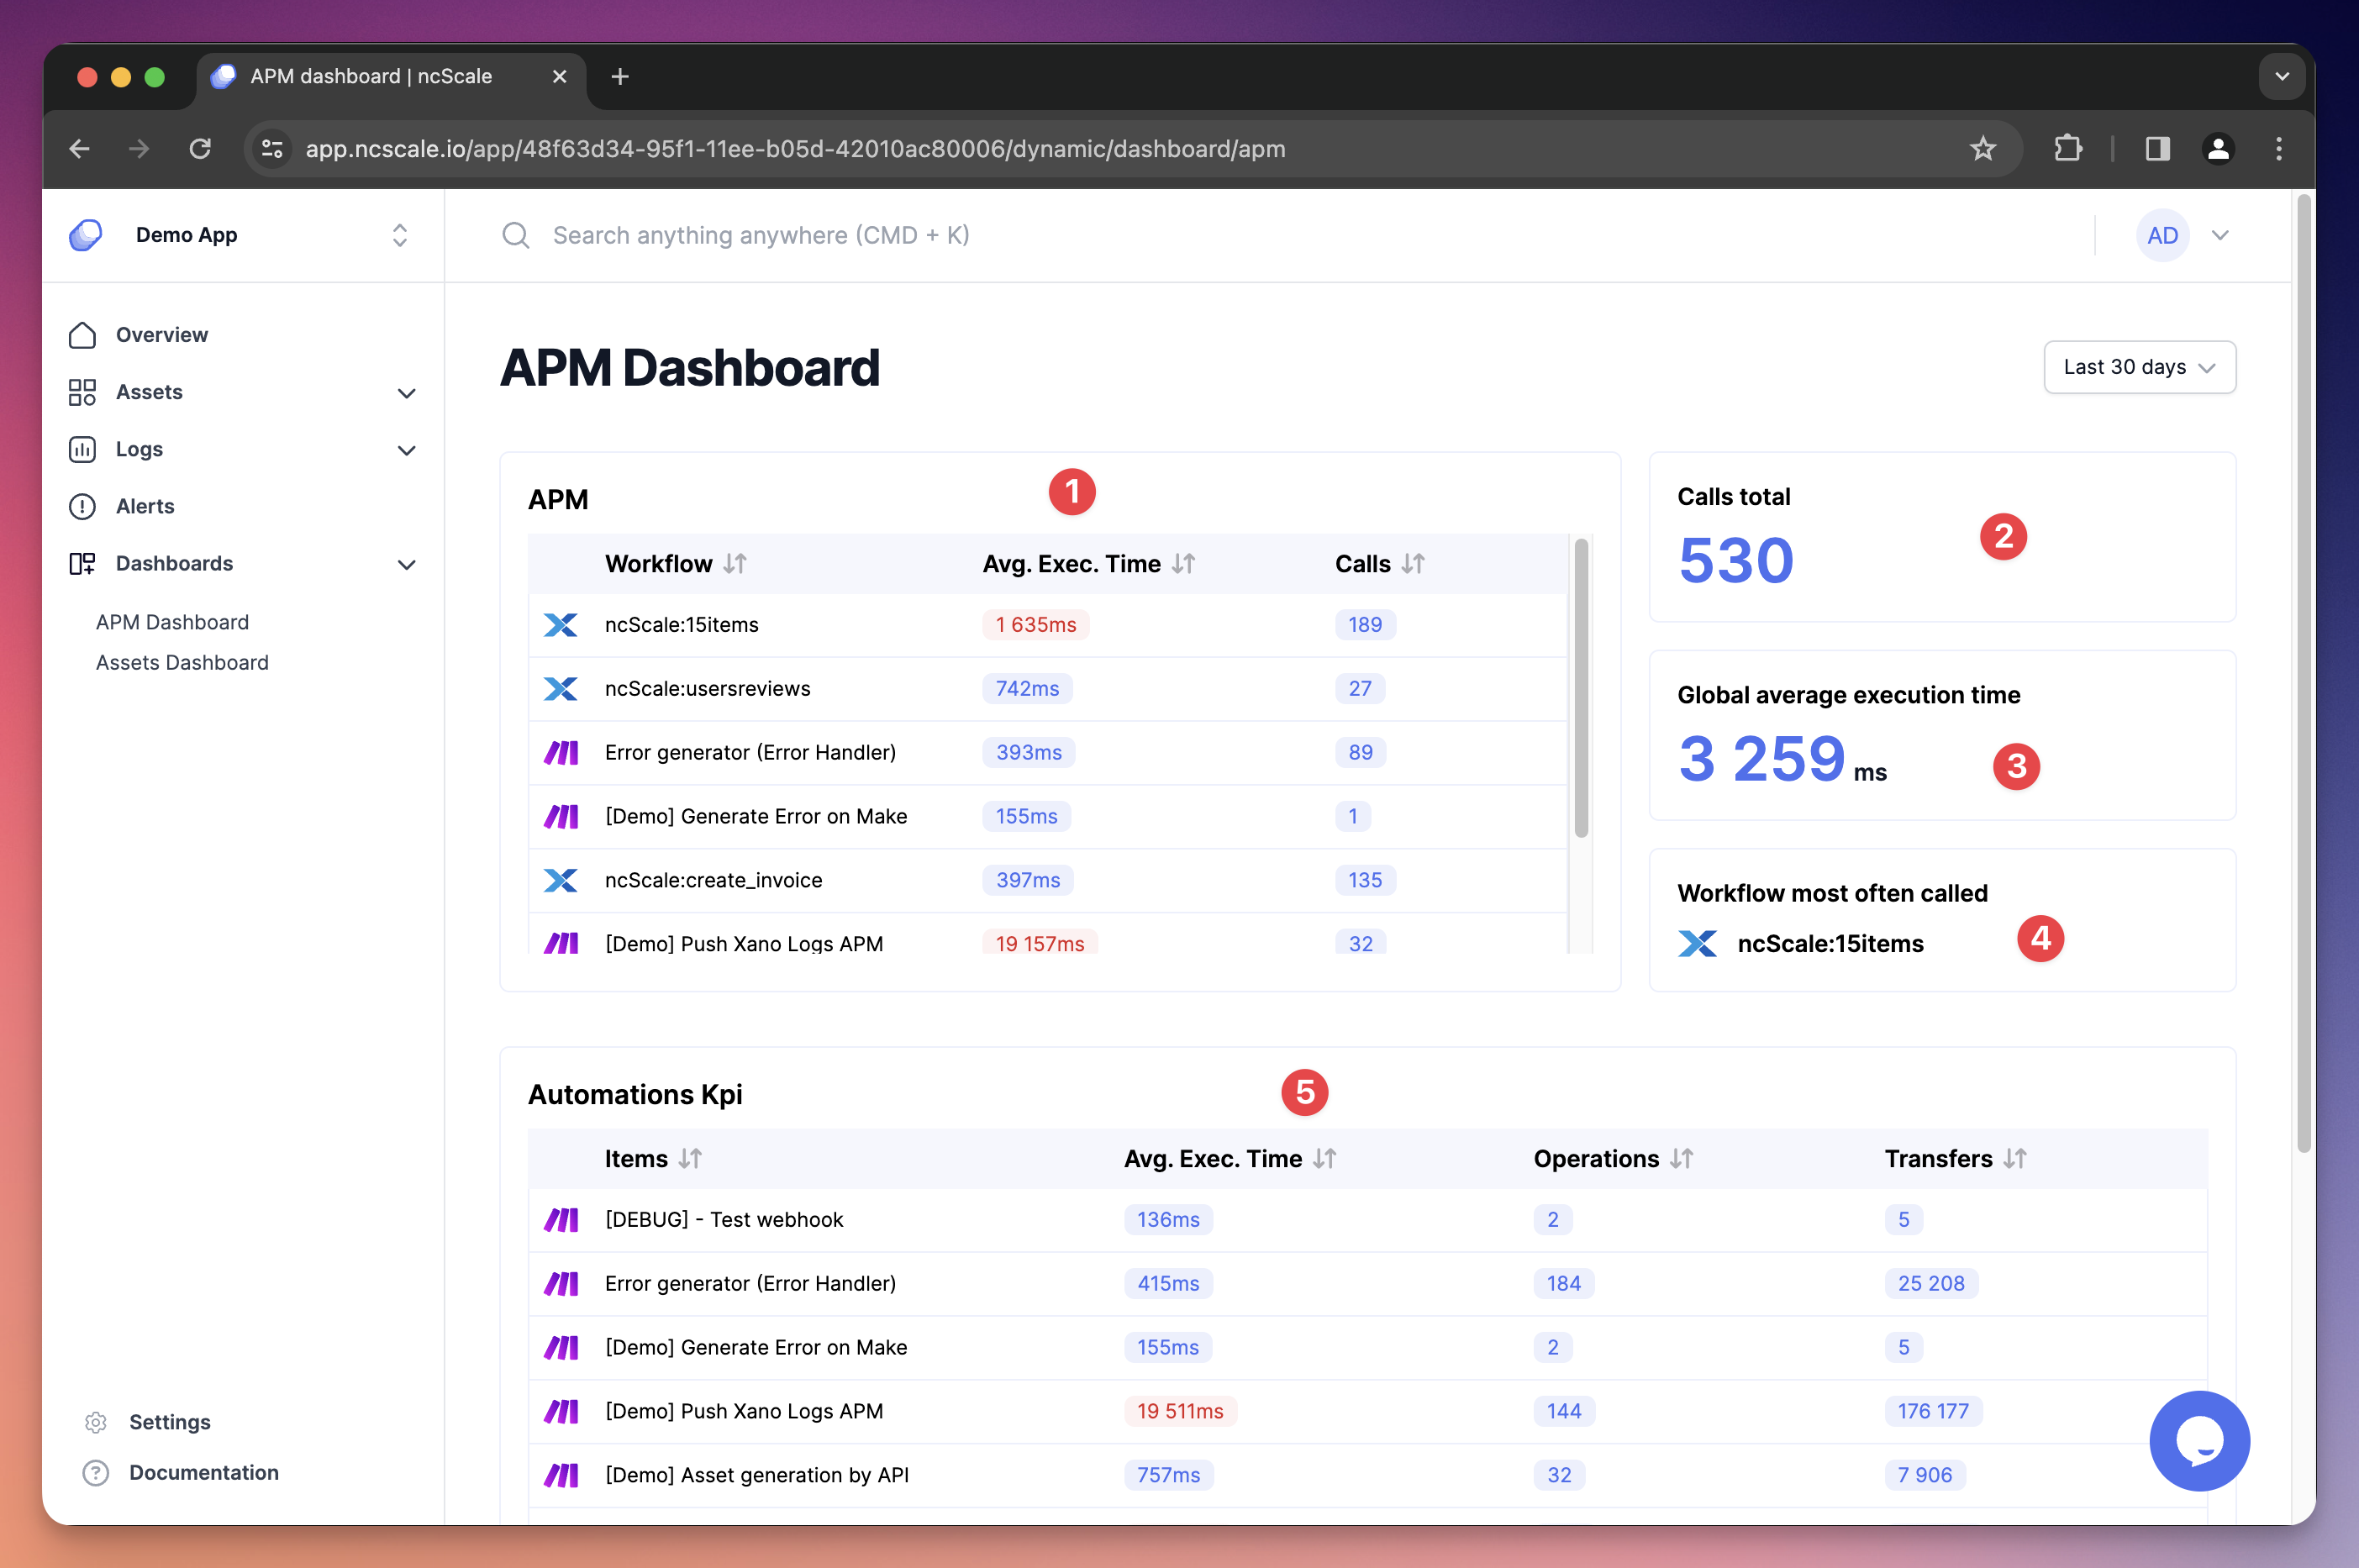
- 1 : The APM table provides detailed information for each workflow (clicking on a row takes you to the corresponding asset):
- Workflow name
- Average execution time of this workflow
- Number of calls to this workflow
- 2 : Total number of calls to your workflows
- 3 : Total average execution time of your workflows
- 4 : Most called workflow
- 5 : The statistics table for automations provides more specific information about automations (clicking on a row takes you to the corresponding asset):
- Workflow name
- Average execution time of this workflow
- Number of operations executed in this workflow
- Total number of data transferred in this workflow
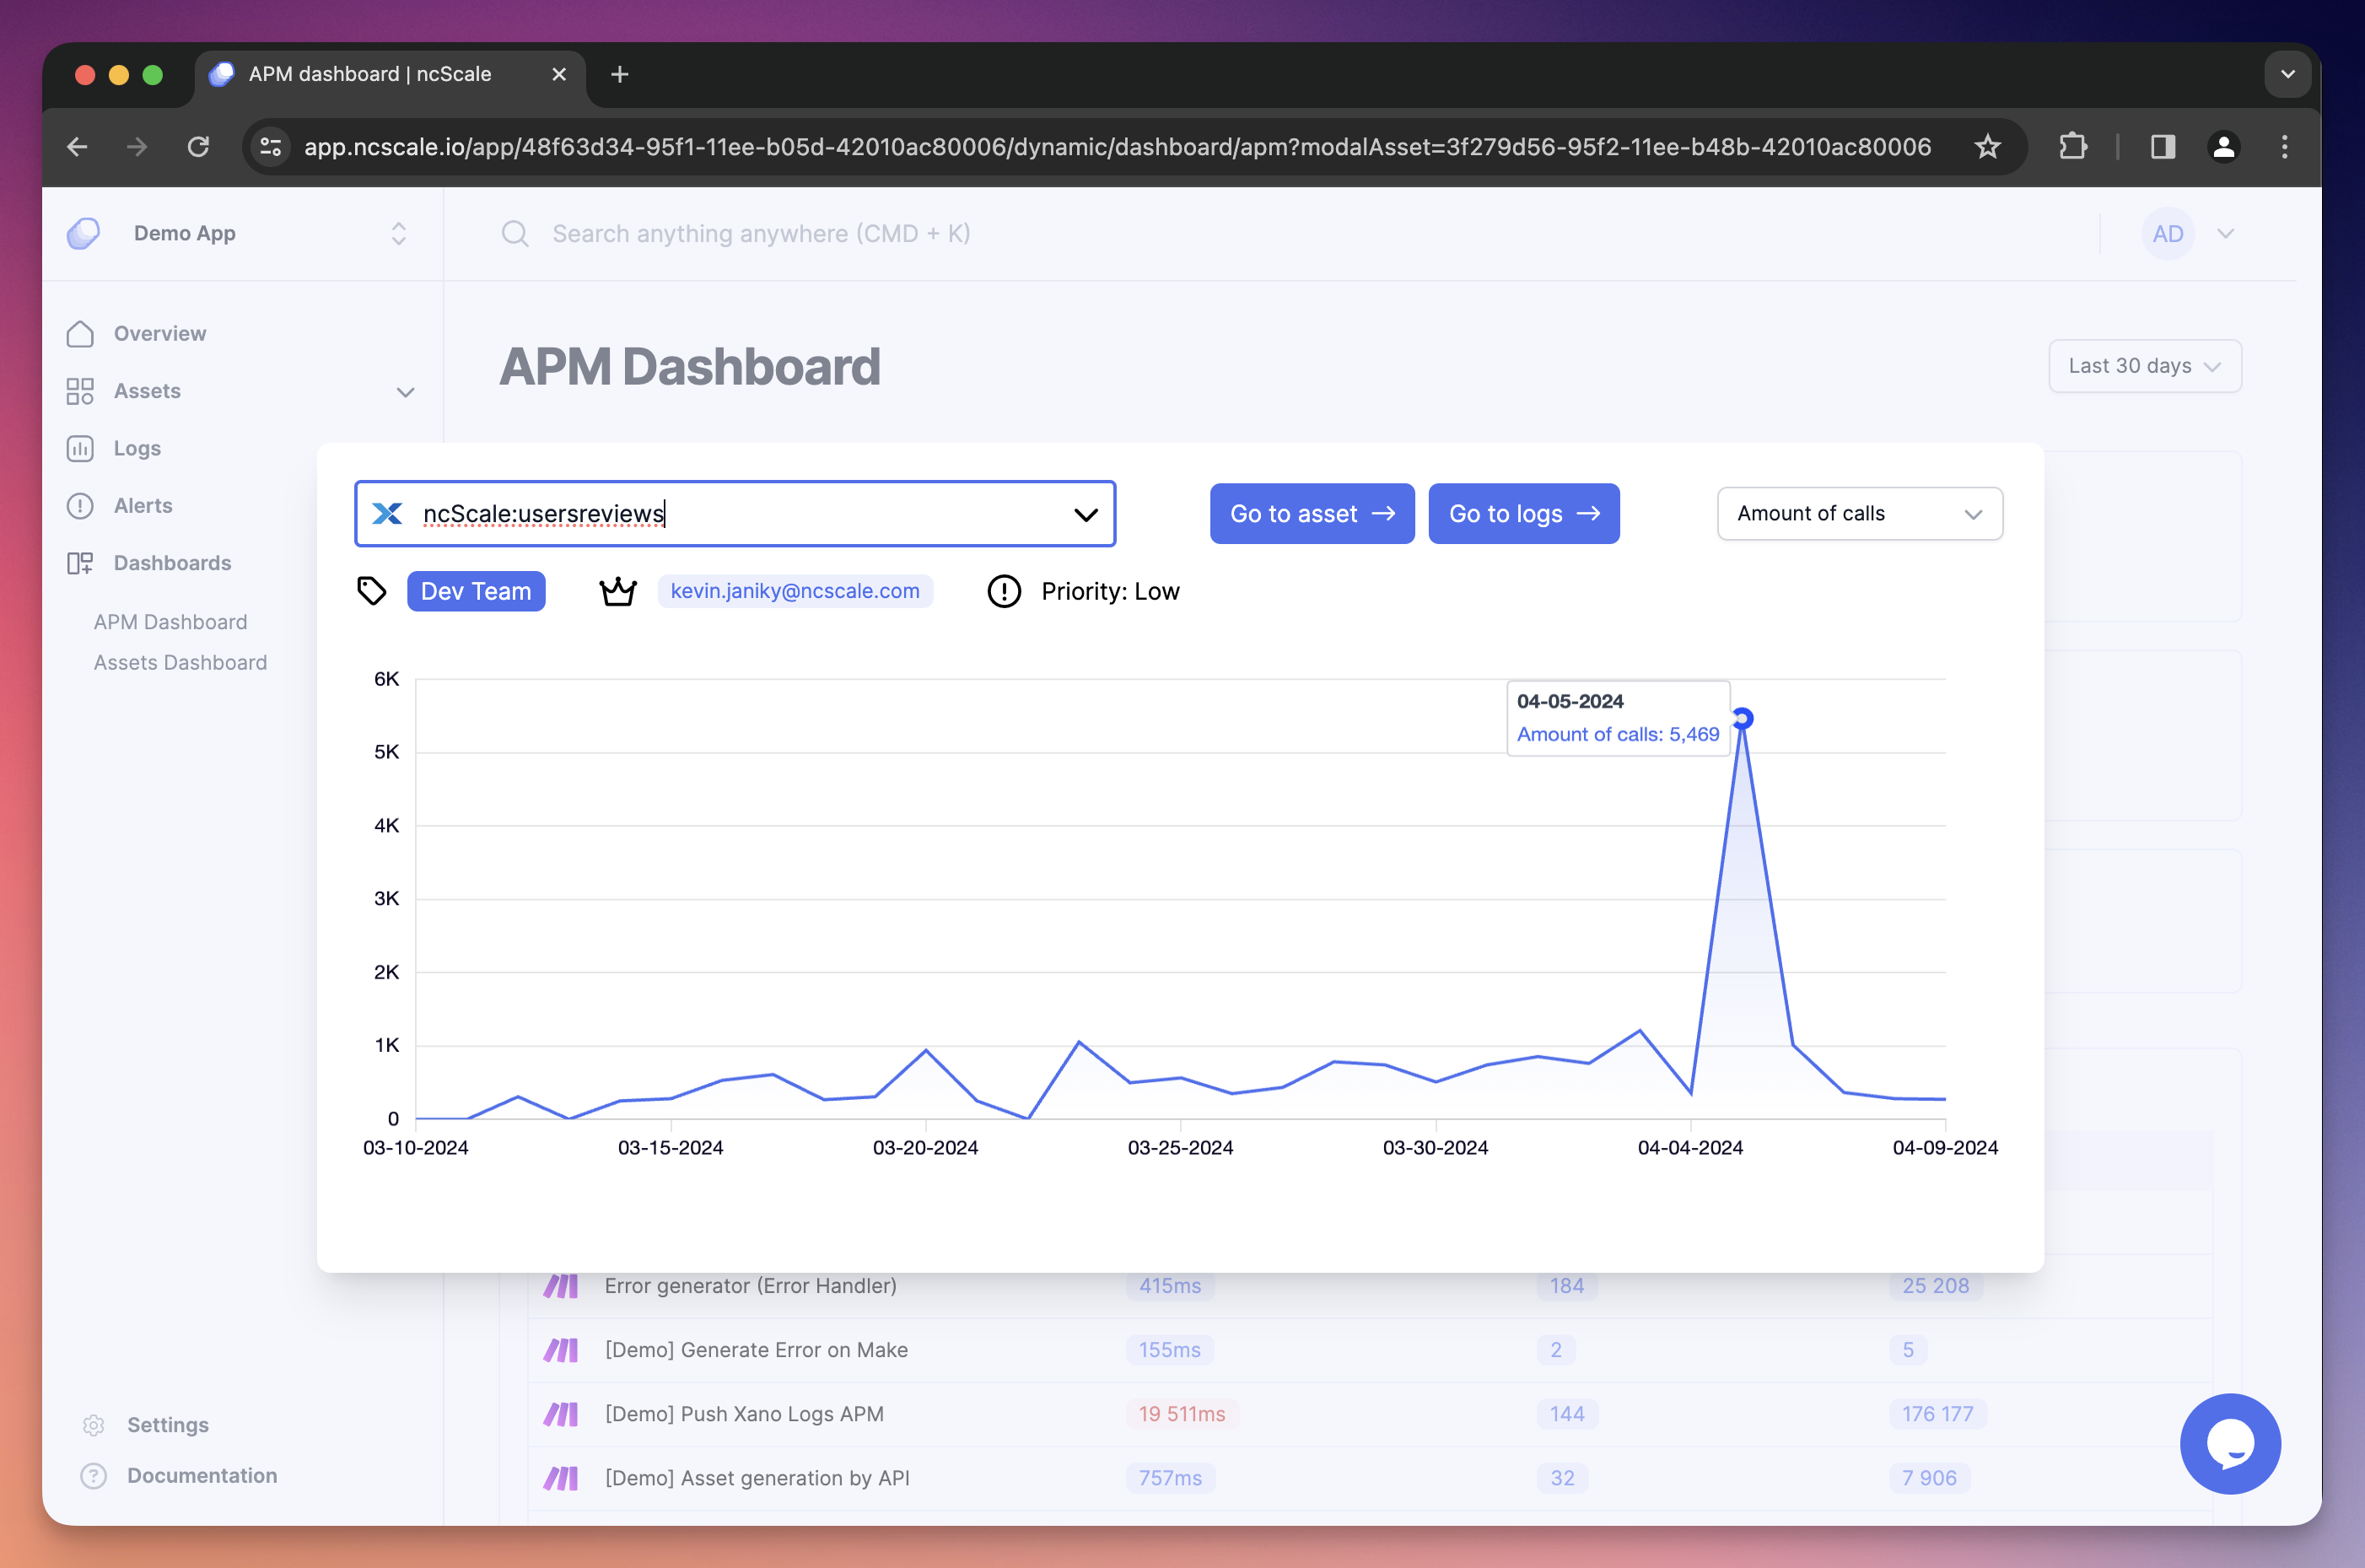
Clicking on a row in the APM table opens a modal. In this modal, you can find a graph to track the usage evolution of the selected asset through different views: Average execution time, amount of calls, amount of transfers and amount of operations (depending on the selected asset, certain views may not be available).
Direct access to the asset, its corresponding logs, and information about the asset (tags, owner, and priority) are also displayed for quick access to information.
Assets Dashboard
The Assets dashboard provides you with an overview of your assets along with their statistics. Get a quick glance at the distribution of priorities for your assets, the number of assets for each tag/owner, the number of dependencies, and the number of assets missing information.
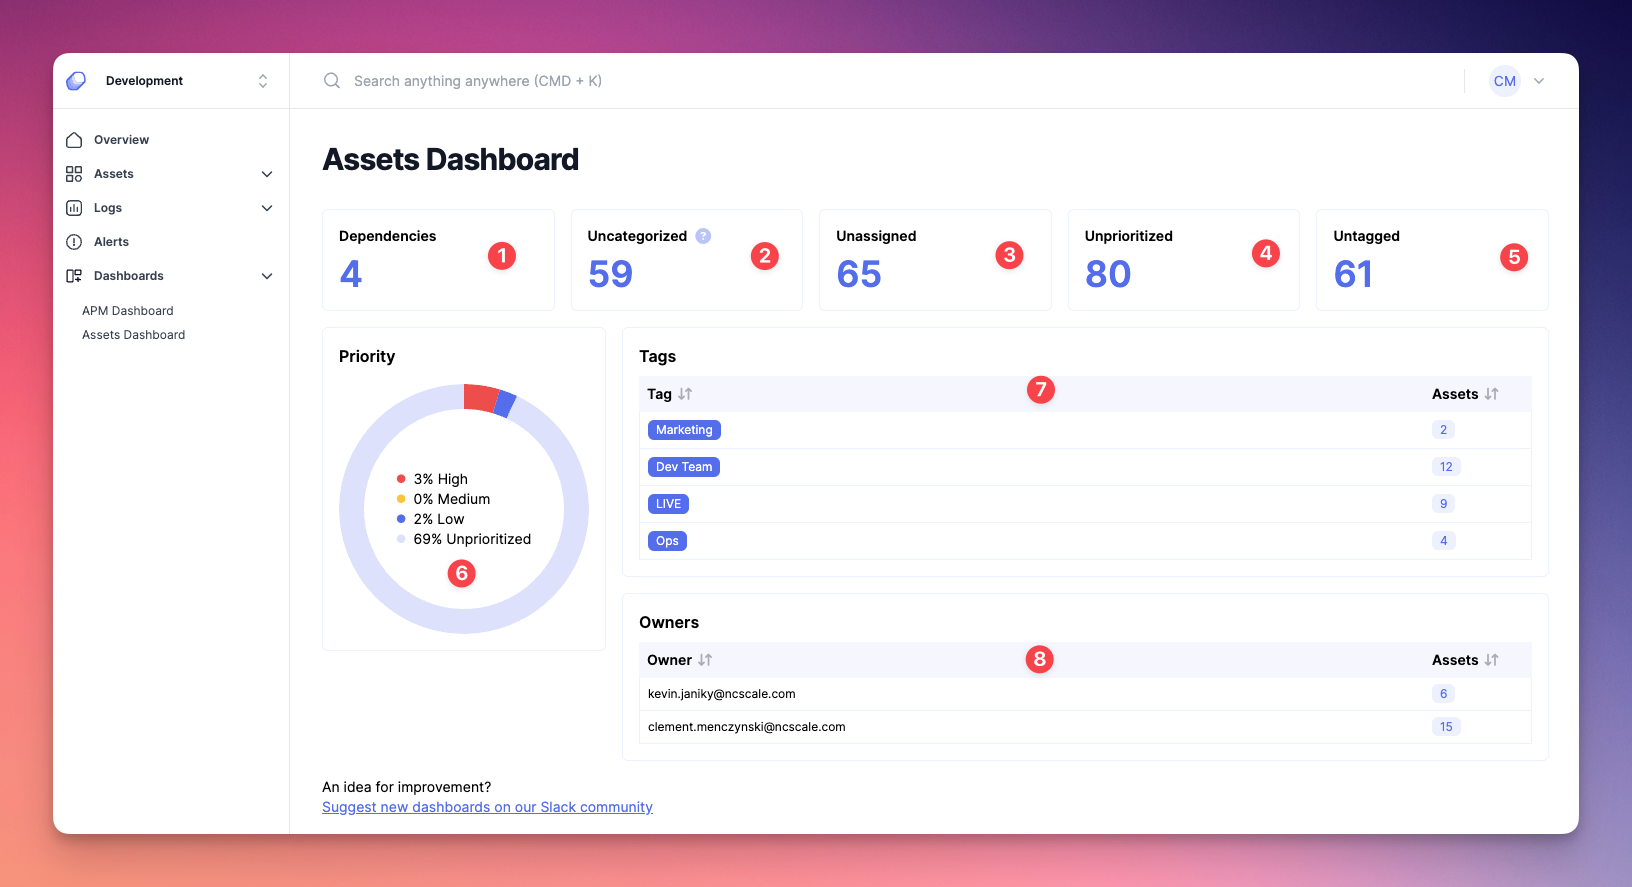
- 1 : Total number of dependencies between your assets
- 2 : Number of uncategorized assets
- 3 : Number of assets without an owner
- 4 : Number of assets without priority
- 5 : Number of assets without tags
- 6 : Distribution of priorities for your assets
- 7 : This table provides the number of linked assets for each tag.
- 8 : This table provides the number of linked assets for each owner.